Financial institutions leave 30% of revenue on the table annually from process inefficiency. That number comes before any discussion of methodology, tooling, or talent—because the gap almost always starts with the plan, not the people.
Before we go further: a process improvement plan is not a Performance Improvement Plan. If your manager handed you a document labeled "PIP," you're in HR territory—a structured corrective process for individual performance. What this article covers is different: the operational document that defines how an organization identifies broken workflows, designs fixes, and tracks whether those fixes actually held. The two share an acronym. They share almost nothing else.
This confusion is more than semantic. PMBOK—the Project Management Body of Knowledge—removed the formal Process Improvement Plan as a named artifact in later editions. That left a gap. Teams working on Lean Six Sigma and operational transformation projects were left piecing together what "the plan" should contain, often defaulting to vague intention documents that read like aspiration rather than instruction.
This article fills that gap. It covers what a genuine process improvement plan contains, why most fail, and what made the difference in a Kuwait bank case where processing time dropped from 139 days to 57 days in Phase 1—a 59% reduction—before Phase 2 brought the number down further to 33.5 days, a 75.9% cumulative improvement from baseline.
The short answer: the plan that produced that outcome wasn't a document describing intentions. It was a decision sequence.
Why most process improvement plans don't deliver
Roughly 70% of organizational improvement initiatives fail to sustain their gains. That number has held steady for decades, across industries and geographies. The plans exist. The intent is genuine. The results don't follow.
When you look at failed initiatives closely, the pattern is consistent: the plan described what the team wanted to happen, not what the team would do when they got the data back. There were goals but no gate logic. There were milestones but no criteria for what "passing" meant. There were metrics but no decision rules attached to them.
A process improvement plan that describes intentions is a wish list. One that describes decisions is an operating mechanism.
Banks face a compounded version of this problem. Process inefficiency costs financial institutions 30% of annual revenue—a figure that scales to $3 trillion in losses across global banking. That's not a technology problem. It's a planning problem. The opportunity in banking operational improvement isn't unlocked by tools; it's unlocked by structured decision-making about which processes to fix, in what order, with what data confirming progress.
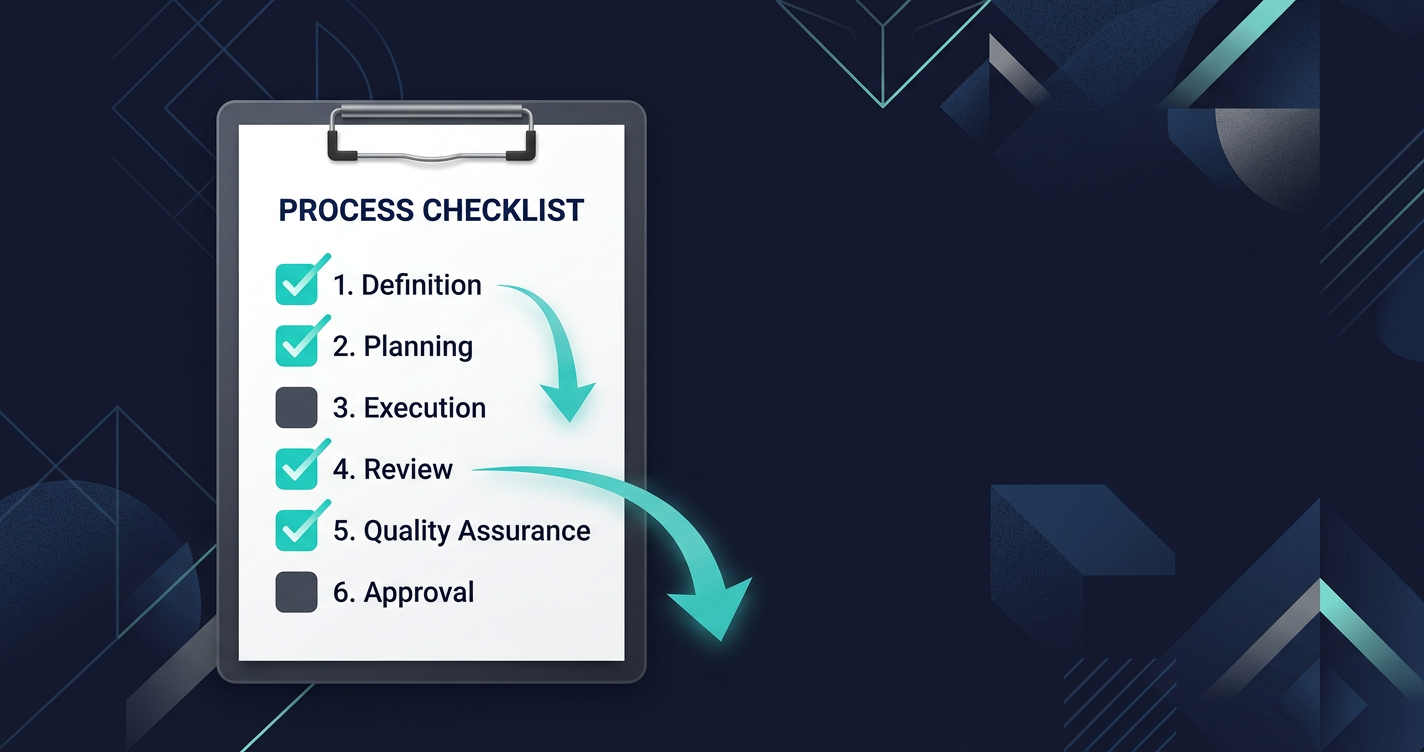
The 6 components of a plan that produces results
A working process improvement plan has six components. Not sections—components. Each one exists because the next depends on it.
1. Current state baseline
Before any improvement is possible, you need a documented, measured account of how the process works today. Not how it's supposed to work. Not the version in the policy manual. How it actually runs, with actual times, actual error rates, and actual handoff points.
The baseline serves two functions. It anchors the problem statement in evidence rather than perception. And it becomes the comparison point against which all later measurement is made. A team that skips the baseline will later argue about whether anything changed.
For the Kuwait bank engagement, this meant mapping every stage of a financing application—from submission through credit review, compliance checks, documentation, and disbursement. That map revealed the 139-day average. Nobody had measured it before. The number surprised the leadership team.
See our guide to DMAIC in banking for the measurement methodology that supports this phase.
2. Problem statement in measurable terms
A problem statement that can't be measured can't be solved. "Processes are slow" is not a problem statement. "Average financing processing time is 139 days against an industry benchmark of 60–75 days, resulting in approximately 23% application abandonment" is a problem statement.
The measurable version does three things: it defines the gap, it establishes the unit of measure, and it implies the scale of change required. Teams that skip this drift. Every discussion becomes subjective. Every proposed fix gets evaluated against an invisible target.
The E-S-S-A-M framework (Eliminate, Simplify & Standardize, Automate, Migrate) treats the problem statement as a gate requirement—you cannot proceed to root cause analysis until the problem is expressed in numbers. This isn't bureaucratic caution. It's the only way to know whether you've fixed anything.
3. Root cause hypothesis
Note the word: hypothesis. Not root cause. Not diagnosis. Hypothesis.
The difference matters because organizations consistently mistake symptom removal for root cause resolution. A process is slow because of a backlog. Remove the backlog. The process is slow again six months later because the cause of the backlog—a sequential approval structure requiring three departments to review the same document in series—was never addressed.
A root cause hypothesis is a structured, testable claim about the mechanism driving the problem. It should be specific enough to be falsified. "We believe the primary driver of processing delay is sequential document review in the compliance and credit stages, which creates a bottleneck at peak volumes" is a hypothesis. "Our processes have too many steps" is not.
The hypothesis phase should produce 3–5 candidate causes, ranked by estimated contribution to the measured gap, each with a defined test that would confirm or refute it.
4. Improvement design
Most teams spend too much time here relative to the other components. The design—new process flows, automation logic, role changes, handoff protocols—matters, but it's downstream of the diagnosis. A well-structured improvement design is almost a mechanical output of a rigorous root cause hypothesis.
For the Kuwait bank project, improvement design meant restructuring the approval sequence to allow parallel processing of credit and compliance review where document sets permitted, introducing automated pre-screening to remove applications missing documentation before they entered the review queue, and defining escalation criteria so exceptions didn't sit in ambiguous status.
Those changes weren't novel. They were logical responses to the specific bottlenecks the hypothesis phase identified. The design required discipline, not creativity.
5. Gate decisions with data triggers
This is the component most plans omit entirely—and that omission is the primary reason plans fail.
A gate decision is a predefined choice point: if the data shows X, proceed to Y; if the data shows Z, return to W. Gate decisions convert a plan from a static document into a responsive operating system. They answer the question: "What would make us change course?"
Gates should be specific. "If 30-day post-implementation data shows processing time below 90 days, proceed to Phase 2 pilot expansion" is a gate. "We'll review results and decide next steps" is not a gate. It's an invitation for the loudest voice in the room to determine what happens next.
Gate decisions also serve an accountability function. When data at a checkpoint is ambiguous or negative, gate logic determines the response before organizational politics enter the conversation.
Use our process improvement KPIs guide to define the right metrics for each gate.
6. Checkpoint schedule at 30, 90, and 365 days
Improvement doesn't end at go-live. It begins there. The checkpoint schedule defines three mandatory review points:
30 days: Confirm the new process is being followed. Measure early indicators. Identify training gaps or procedural confusion. Don't draw conclusions about outcome metrics yet—the system hasn't stabilized.
90 days: First meaningful outcome read. Compare against baseline. Confirm or challenge the root cause hypothesis based on what the data shows. Make the gate decision documented in Component 5.
365 days: Sustainability audit. Has the improvement held? Have adjacent processes adapted to the new throughput? Are the gains compounding or eroding? The 12-month checkpoint is where organizations find out whether they made a structural improvement or a temporary fix.
The Kuwait bank decision sequence: Gates 1–6
The Kuwait bank case shows what a decision-sequence plan looks like in practice. Each gate had defined data requirements and a defined decision attached to that data.
| Gate | Stage | Data Collected | Decision Made |
|---|---|---|---|
| Gate 1 | Baseline established | 139-day average; 23% abandonment rate; bottleneck map showing compliance/credit sequential dependency | Proceed to root cause hypothesis |
| Gate 2 | Hypothesis confirmed | Time-in-stage analysis confirmed 47% of total processing time in compliance-credit handoff | Proceed to parallel-processing redesign |
| Gate 3 | Pilot design approved | Redesigned workflow mapped; 12-application pilot cohort defined; success criteria set at ≥30% time reduction | Proceed to controlled pilot |
| Gate 4 | Pilot results reviewed | 30-day pilot: average 89 days; 36% reduction; no compliance breach incidents | Proceed to full Phase 1 deployment |
| Gate 5 | Phase 1 complete | 139→57 days; 59% reduction; abandonment rate dropped from 23% to 11% | Proceed to Phase 2 scope definition |
| Gate 6 | Phase 2 complete | 57→33.5 days; 75.9% cumulative reduction from 139-day baseline | Lock gains; initiate sustainability audit |
The plan wasn't impressive because it produced a 75.9% improvement. It was impressive because at Gate 4, if the pilot had shown compliance breach incidents alongside the time reduction, the gate logic would have sent the team back to improvement design—not forward to deployment. The decision was pre-made. The data just executed it.
Template: what to include in each section
| Section | What to include | Kuwait bank example |
|---|---|---|
| Current State Baseline | Process map, cycle time data, error rates, volume data, handoff points | 139-day average financing cycle; sequential compliance/credit structure; 23% abandonment |
| Problem Statement | Measured gap, unit of measure, business impact in quantifiable terms | Processing time 139 days vs. 60–75 day benchmark; $X in deferred revenue per quarter |
| Root Cause Hypothesis | 3–5 candidate causes ranked by estimated contribution; test for each | Sequential compliance/credit review = 47% of cycle time; pre-screening absent = 18% rework volume |
| Improvement Design | New process flows, automation logic, role changes, handoff protocols | Parallel processing where document sets permit; automated pre-screening; escalation criteria |
| Gate Decisions | Data trigger for each gate; decision logic (proceed/return/escalate) | Gate 4: if pilot shows ≥30% reduction with zero compliance breach → proceed to full deployment |
| Checkpoint Schedule | 30/90/365 day review dates, metrics to review, decision owner for each | 30-day: process adherence; 90-day: outcome metrics vs. gate criteria; 365-day: sustainability audit |
Use our process cost calculator to quantify the business impact figures for your problem statement section.
The test your plan must pass
Read your plan and ask three questions:
Can you identify exactly what data you are collecting at each stage? If the answer is "we'll track things and see how it goes," you don't have a plan. You have a monitoring intention.
Can you identify what that data would change? If every possible data outcome leads to the same next step, your gates are decorative. The plan has no decision logic.
Is there a data outcome that would cause you to reverse course? If the plan only moves forward regardless of results, it isn't a plan. It's a commitment ceremony.
The Kuwait bank plan passed all three tests. That's the standard worth setting.
Where ESSAM fits
ESSAM is an agentic AI platform built for banking operations, structured around the E-S-S-A-M framework (Eliminate, Simplify & Standardize, Automate, Migrate). The framework encodes the six-component methodology described above—baseline, problem statement, hypothesis, design, gates, and checkpoints—and applies AI-assisted pattern analysis to accelerate the diagnostic phases that typically consume the most calendar time.
The 139→57 day improvement didn't happen because a team worked harder. It happened because the diagnostic phase identified the right bottleneck—sequential compliance/credit dependency—rather than treating all delays as equivalent. ESSAM accelerates that diagnostic step; the process judgment still belongs to the practitioners running the engagement.
For banking operations teams carrying 80% manual documentation processes, the gap between intention and outcome is almost always a planning gap—not a talent gap, not a technology gap, and not a motivation gap.
Frequently Asked Questions
What is the difference between a process improvement plan and a project plan?
A project plan defines deliverables, timelines, and resources for completing a defined scope of work. A process improvement plan defines the current state baseline, the measurable problem, root cause hypotheses, the improvement design, gate decisions, and long-term checkpoints. A project plan describes what you will build. A process improvement plan describes what you will learn, decide, and change—and under what conditions you will change course.
How long should a process improvement plan be?
Length is secondary to completeness. A plan that covers all six components in 8 pages is more functional than a 40-page document that describes goals without decision logic. The real test: can a team member who didn't write the plan read it and know exactly what data to collect, what that data means for each gate, and who makes the call at each decision point?
When should you use DMAIC vs. a process improvement plan?
DMAIC (Define, Measure, Analyze, Improve, Control) is a methodology. A process improvement plan is a document. They work together: the plan records decisions made at each DMAIC phase. Teams that run DMAIC without documenting gate logic and checkpoints often lose their gains within 12–18 months because the knowledge lives in people's heads, not in a recoverable document. See our DMAIC in banking guide for how the phases map to each plan component.
What should trigger a process improvement initiative in a bank?
Four common triggers: (1) customer complaint volume rising above a defined threshold, (2) processing times exceeding internal benchmarks or regulatory requirements, (3) error rates generating rework costs above a cost-of-quality threshold, and (4) competitive or regulatory pressure requiring operational efficiency gains within a defined window. Any of these should start with a baseline measurement—the baseline determines whether the trigger reflects a real performance gap or a perception gap.
How do you measure whether a process improvement plan succeeded?
Success has two layers. First: did the process metrics reach the target defined in the problem statement and confirmed at each gate? For the Kuwait bank case, the target was sub-90 days at Phase 1 completion; the result was 57 days. Second: did the gains hold at the 12-month sustainability checkpoint? Many initiatives show strong 90-day results that erode by month 18 because the control mechanisms—training, documentation, escalation criteria—weren't embedded in daily operations. A plan that only measures outcomes at go-live is measuring the wrong thing.
If your team is working through a process improvement initiative in banking—or building the case for one—talk to the ESSAM team. The diagnostic phase is where most time is lost. It's also where the right structure saves the most.